In a company whose clients pay fees for various periods, there are delays in the collection of these fees. To control the overdue premiums, a bespoke sheet was created, which is prepared to work with the overdue contributions, up to five years. The goal is to calculate the average amount for the last ten weeks, for each branch of the company, from a date to be determined by the user.
The difficulty of this sheet is in the calendars that have to be established, since the template allows to collect the amounts in debt from the various delegations that the company has, per week. Furthermore, once the year has ended, the outstanding amounts from the previous year must be carried forward. For this reason, the Excel book has up to five years separated into different sheets. That is, the composition of the book is one sheet to establish the calendars and five more sheets to enter the amounts per delegation and per week for each year. The composition and operation of the template is explained in more detail below.
The Excel book approach is based on weeks. This means that for each year, we need to know if there are 52 or 53 weeks. For this reason, initially, the book has a five-year calendar sheet. These calendars will allow us to know in which week any date falls.
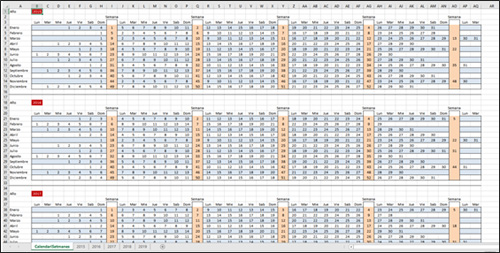
The first sheet sets out the calendars for the five years contained in the template. The formulas are assembled in such a way that the user only has to enter the year. The formulas then show the number of the day per month and per day of the week, further grouped by week and showing the number of the week. We show an image:

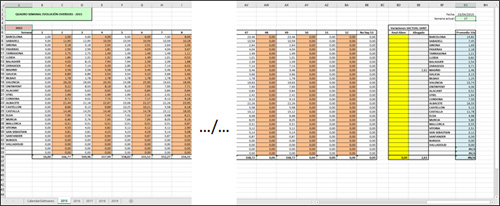
In the sheets corresponding to each year, we have a table with the list of all the company’s branches, along a column. The numbers of the weeks are distributed along a row. The data that the user enters is the sum of the outstanding amounts, of the quotas of each delegation, for each week. The interesting thing about these sheets is at the end of the table, where the formulas calculate whether there are 52 or 53 weeks, so that the operator knows when to stop entering amounts. And in the last column, the average of the amounts for the last ten weeks is calculated, based on a date to be entered by the user. The formulas calculate the number of the week corresponding to that date and average the previous 10 weeks. This allows you to know what the average debt is, at any date of the year and of the respective ten previous weeks. The calculation is complicated in the following years, because the last ten consecutive weeks are taken into account, that is, if the date entered, to obtain the average, is in January, the weeks of the previous year must be taken into account, to complete the ten weeks of the average. We show an image:

The formulas used in this workbook are Date and Time, Math, Text, Lookup and Reference, and Logic.
Application made with Excel. To use this application you need to have the MS Excel program. The application is made in Catalan language. It can be translated and adapted. Note: The data inserted in the images are fictitious.

